Critical Chain Project Management (CCPM) is a project management method derived from a management methodology called the Theory of Constraints (TOC)[1].
Critical Chain combines insights into both the nature of uncertainty and human behavior to result in significant improvements in project performance.
Traditional project management
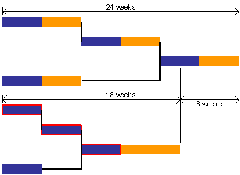
Consider a simple project, consisting of four tasks, each of equal duration, as pictured.
In a perfect world — a world free of uncertainty — it would be possible to build a project plan (as per the Gantt chart above) and provide each project resource with a task list, where each task has a fixed start and finish date.
We do not live in a perfect world, however.
We know that it is impossible to predict the duration of each task with total precision.
For this reason, the standard approach to project management is to allow for uncertainty by adding safety (contingency) to each task. It is usual for each task to contain enough safety to ensure a 90% probability of on-time completion.
As you can see, this results in a significant increase in project duration.
In reality, the increase in project duration is far greater than pictured. This is because this approach to project management encourages negative behavior on the part of individual resources.
Specifically, when people are allocated tasks with built-in safety they tend to start work as late as possible (remember your school assignments) and, as a consequence, will often overrun the planned finish date. What’s more, traditional project environments discourage resources from handing-in work early (this will surely result in less allocated time next time!)
The result of these behaviors is that each resource will never use less than the time allocated, but will sometimes use more.
Inevitably, this results in projects running overtime, in spite of the massive amounts of embedded safety.
The traditional approach to performance improvement is to attempt to plan at a more granular level (meaning that a project that once contained 100 tasks, now contains 500). More tasks means that the total amount of safety contained in the project increases. It also means more task hand-offs; which means more opportunities for time overruns.
In other words, the traditional approach to performance improvement perpetuates the underlying problem!
Critical Chain Project Management (CCPM)
CCPM recognizes that these undesirable (behavioral) effects are due to the combination of embedded safety and fixed start and finish times.
CCPM eliminates the former by stripping safety out of individual tasks and allocating it to the end of the project in what’s called a project buffer.
CCPM eliminates the latter with a relay-racer approach to resource management. What this means is that:
1. Resources are provided with one task at a time (multitasking is eliminated).
2. Resources are provided with a countdown to task arrival; so they can ready themselves to begin work the moment work arrives
3. When work arrives, they complete it as fast as possible (providing daily progress updates to the project manager)
4. As soon as the task is completed, they hand it off to the next resource (who is awaiting its arrival)
The result of this approach to workflow management is that any time that’s saved on individual tasks is saved on the project as a whole.
Managing uncertainty
Let’s now turn our attention to the safety — which (you’ll remember) has been aggregated and added to the end of the project.
It’s perfectly acceptable to allocate this safety to the project as a whole — rather than to individual tasks. This is because what’s really important is when the project as a whole finishes, not when individual tasks finish.
As it happens, aggregating the safety and adding it to the end of the project provides us with another benefit (in addition to the benefits of the relay-racer approach to task management).
When we aggregate the safety we discover that we now need less safety to provide the same degree of protection at the project level than we did at the task level. This is because the time savings cancel out some of the delays.
If you are statistically inclined, you’ve probably guessed that you can calculate the size of the Project Buffer by squaring the individual task safeties, and then finding the square-root of their sum:
If you’re not statistically inclined, don’t despair. It so happens that the most accurate method for calculating Project Buffer size is a good deal simpler.
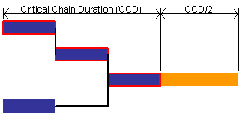
The Project Buffer required to ensure 90% probability of on-time completion is equal to 50% of the duration of the project’s longest chain of tasks, as pictured below.
The project’s longest chain of tasks is called the Critical Chain (it’s represented above by the tasks with red outlines). The Critical Chain is important because it’s this set of tasks that determines project duration. As you can see from the illustration above, a project can include tasks that are not part of the Critical Chain. While these tasks are obviously necessary for the completion of the project, they do not impact on project duration (well, they can, but we’ll consider this case in a moment).
Technically, the Critical Chain is defined as the longest chain of tasks, taking both task and resource dependencies into account.[2]
It’s worth pausing for a moment to review the magnitude of what we’ve achieved.
As a result of:
1. the elimination of fixed start and finish dates for tasks, in favor of the relay-racer approach; and
2. the aggregation of task safety into the project buffer;
we have managed to slash project duration by 25%! (And this is ignoring the fact that the behaviors fostered by start and finish dates inevitably result in projects managed using traditional methods running late.)
We now need to give further consideration to tasks that do not form part of the Critical Chain. As mentioned previously, in theory at least, these tasks do not impact on project duration. In practice, they can!
Imagine that the task terminating in the Critical Chain in the previous diagram, were to run very late. Obviously, it’s conceivable that it could impinge on the Critical Chain — delaying the project as a whole.
Now, at the point at which this occurs, the Critical Chain has technically shifted. However, recognizing this in retrospect is of little value; you need to anticipate (and plan) for this eventuality in advance.
We can do this by considering this task (and any of its antecedents) as a mini-project, and then protecting it against uncertainty using the same method we applied to the Critical Chain.
You’ll recall that we protected the Critical Chain by adding a project buffer equal to 50% of the Critical Chain duration. Well we can protect the chains of tasks that terminate in the Critical Chain with their own buffers (what we call feeding buffers).
As you may already have guessed, a feeding buffer is equal to 50% of the duration of the tasks that make up what we call the feeding path (a chain of tasks that terminates in the Critical Chain).
The result is pictured below.
You’ll notice something interesting about the illustration above.
The feeding path has been programmed for what’s called a late start. The thing is, if the feeding path is protected by the feeding buffer, we no longer need the additional safety afforded by programming an early start.
Programming tasks for a late start provides us with two benefits:
1. We minimize the amount of work-in-progress (and consequently maximize our ROI)
2. We have the ability to use the free resource for some other purpose
Management intelligence
Once a project is in progress, the project manager’s primary challenge is to determine where and when to intervene (exert management control).
Obviously this requires that the project manager view the progress of various tasks and make predictions about their impact on the performance of the project as a whole.
In a traditional project environment, this is very difficult. However, in a Critical Chain environment, the relay-racer approach to workflow management in combination with the aggregation of safety into strategically located buffers makes it easy to make such predictions.
Consider, for a moment, the implications of eliminating safety from individual tasks.
We know that the odds are 50:50 that each task within the project will complete in the estimated time. Each time a task runs overtime, some of the safety in the buffer protecting that path is consumed. Each time a task finishes before-time, some of that time is credited-back to the relevant buffer.
Now, if we can compare the percentage of the duration elapsed for that particular path with the percentage of the buffer consumed thus far, we have an indication of how that path is tracking, relative to our expectations. If the path under consideration is the Critical Chain, we have an indication of the performance of the project as a whole.
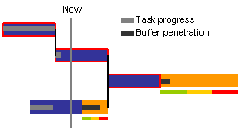
If you take a look at the Critical Chain (highlighted in red) in the following illustration, the now line indicates how much work on the chain should have been completed thus far.
You’ll notice that the light grey progress bar indicates that the work on the Critical Chain is slightly behind expectations. The distance between the end of this progress bar and the now line appears within the Project Buffer as what we call Buffer Penetration (the dark grey line).
Exactly the same logic apples to the feeding path below the Critical Chain.
Now, if buffers are penetrated, it’s not necessarily a bad thing. In fact the odds are negligible that a project could be completed without any buffer penetration.
What’s important is the degree of buffer penetration, relative to the percentage of the project duration elapsed.
To provide the project manager with the necessary management intelligence, all the project manager does is divide each of the buffers into three zones of equal duration (green, amber and red).
Each of these zones has an instruction associated with it:
1. Green: Do nothing (your intervention is likely to do harm)
2. Amber: Observe and plan, but do not intervene
3. Red: Intervene, and take steps to expedite the project out of the red zone
These instructions enable the project manager to direct his limited capacity to where it will produce the greatest overall benefit.
Buffer penetration also provides the project manager with valuable feedback for planning future projects. As pictured below, the project manager would expect the project to spend the greater proportion of its time in the amber zone.
If it spends too much time in the red zone, task durations have probably been under-estimated. And, obviously, if it spends most of its time in the green zone, task durations have probably been over-estimated.[3]
In a multi-project environment[4], the project manager can plot the current status of each buffer within each current project in fever charts like the ones below.
These charts provide an immediate indication of if (and where) intervention is required.
In summary, a shift from traditional approaches to project management to Critical Chain promises the following benefits:
1. Significant reductions in project duration
2. Faster ROI
3. Better resource utilization
4. Better management information
[1] For more information on CCPM, read Critical Chain, by Eliyahu Goldratt (ISBN: 0884271536). For more information on TOC, read The Goal, by Eliyahu Goldratt (ISBN: 0884271781).
[2] This differs from what’s commonly known as the Critical Path, which takes just task dependencies into account. The distinction is important because, in eliminating multitasking, Critical Chain stipulates that each resource works on just one task at a time.
[3] If you’re familiar with Statistical Process Control you’ll already have realised that this buffer penetration plot is a source of valuable additional management intelligence; but that’s certainly beyond the scope of this brief introduction to CCPM!
[4] CCPM is more complex in a multi-project environment. This is because projects have to be sequenced in accordance with available capacity on the organisational constraint. Again, this is beyond the scope of this article.


