 and how to fast-track the growth of your business in the process.
 and how to fast-track the growth of your business in the process.
Over lunch, a CEO recently admitted to me that his financial controller was using his organisation’s profits to build quite a substantial commercial property portfolio.
When I asked if this was best use of his organisation’s free cashflow, he smiled, “How did I know you’d ask that question?
“The fact is,” he continued, “the availability of capital is not currently a constraint on our growth.”
“It might not be a constraint on your organic growth,” I argued, “but I still think that money could be better invested in new client acquisition.”
We spent the rest of that lunch scribbling on napkins. Together, we discovered that a dollar invested in promotional expenditure was actually providing this CEO’s organisation with a better-than 900% return on investment!
By the time coffee was served, we’d agreed that his organisation’s sales process could provide a much more favourable return on capital than even the bluest of blue-chip commercial property investments.
In our experience, this holds true for most organisations. Unfortunately, most are reluctant to invest in their sales processes because (unlike other business processes) it’s impossible to calculate a return on investment.
Science versus art
If you’re a follower of our Relationship-centric Marketing methodology, you’ll know that a sales process has inputs and outputs — just like any other business process.
You’ll know that a sales process (as the word process implies) consists of a sequence of simple, interrelated steps — just like any other business process.
And you’ll know, at least in theory, that each step in a sales process can be measured, managed and optimised — just like any other business process.
This article explains the science (and more importantly, the mathematics) behind sales process management. It will show you how to take control of your sales process and use it to fast-track the growth of your organisation.
If you didn’t pay much attention to mathematics at school, you may find this article tough-going at times. But please be sure to persevere.
I’m sure you’ll discover that your sales process is harbouring significant growth potential!
Management by numbers
If you think about it, the word management presupposes measurement. The fact is, if you can’t measure it, you simply can’t manage it.
So, to manage a sales process (or any process for that matter), we need to know what to measure. Generally speaking, we will measure inputs, outputs and time. Specifically, we’ll measure:
- Throughput (output/time)
- Productivity (output/inputs)
We’ll measure these key performance indicators (KPIs) for the process as a whole, and then we’ll break the sales process into its key components (sub-processes) and devise a set of KPIs for each component.
It’s worth remembering that your sales process is actually a component of a much larger system: your entire business. In the context of your business as a whole, revenue is a measure of throughput, and gross profit is a measure of productivity. The problem with these indicators is that they are trailing indicators: that is, they tell you more about what you have done in the past than they do about what you should do in the future.
Because your sales process is the first step in your entire organisational process, the information you collect from monitoring these performance indicators can be used to enable real-time process optimisation.
As we dissect and analyse the sales process, we’ll make references to a fictitious company we’ll call Correlex. Correlex is an engineering firm that consults to property developers. Correlex’s clients all pay a retainer of $450 a month to access its consulting services. References to Correlex will appear in indented sections, with a green sidebar, just like this one.
Measuring the process as a whole
The objective of your sales process is obviously to generate sales.
This process must be designed and managed to ensure that it delivers a sufficient volume of sales in exchange for a commercially realistic investment.
For simplicity’s sake, we’ll assume that the objective of our sales process is to acquire new clients. But don’t worry, we will be sure to take follow-on sales (and even referrals) into account.
Accordingly, the two global indicators in which we’re most interested are:
- Client acquisition rate (new clients per month).
- Client acquisition cost (cost per new client).
When we’re measuring client acquisition cost, we’re dividing the amount we invested in the acquisition of relationships by the number of clients acquired as a result of that expenditure.
When we calculate this figure, we only take into account the variable costs associated with the promotional campaign that acquired each particular client relationship. With a promotional campaign, variable costs are typically media costs. We do not factor in the fixed costs associated with that promotional campaign (the cost of creating the campaign). Nor do we include the fixed costs associated with the rest of the sales process (e.g. the cost of managing the relationship with the potential client).
We ignore fixed costs because these are the cost of operating your sales process, rather than process inputs.
Our client acquisition cost is most useful for monitoring the performance of our relationship acquisition campaigns. It’s important to remember that, unless you have a very short sales cycle, client acquisition cost tends to be longer-term performance indicator. (The term sales cycle refers to the average time span between the acquisition of a relationship and the consummation of a sale.) We’ll uncover a short-term indicator when we examine the relationship acquisition step of the sales process.
When the CEO of Correlex reviews his organisation’s sales process, he discovers that, averaged over the last 12 months, Correlex acquired two new clients each month.
To determine his average client acquisition cost, he divides his total variable promotional costs by the number of clients he acquired over this period.
In the last 12 months, Correlex had advertised in the Financial Review, and in a number of specialist publications. It had also run 4 direct mail campaigns. Accordingly, its variable promotional costs consisted of the cost of media for the advertising campaigns, and the cost of mail processing for the direct mail campaigns.
In total, Correlex invested $9,600 in order to acquire 24 new clients: an average client acquisition cost of $400.
$9,600 / 24 = $400
Optimisation
It’s obviously important to know how many sales your organisation is making. It’s also nice to know how much each sale is costing you in promotional expenditure.
But, in isolation, this information is not particularly useful.
What you need to be able to do, is compare your actual performance with your optimal performance.
A common mistake in process management is to establish absolutes as targets. For example, it would be tempting to assume that the objective of your sales process is to generate as many sales as possible, for the lowest possible promotional expenditure.
The reality is that sales and promotional expenditure are interrelated. (You can’t have one without the other.) A singular focus on either maximising sales or minimising promotional costs is likely to sub-optimise the performance of your sales process. The key is to determine the optimal relationship between promotional expenditure and sales.
Accordingly, you now need to determine the optimal figures for each of your global KPIs.
Client acquisition rate is easy. Obviously, your optimal figure is determined by the capacity of your production and distribution processes. (There’s little point generating sales that can’t possibly be fulfilled.)
However, your client acquisition cost requires a little more thought.
As the graph below illustrates, as your promotional expenditure increases, the number of clients you acquire should also increase. However, with the increased promotional expenditure, the profitability of each client relationship suffers.
In theory, your optimal client acquisition cost is the point where these two lines intersect.

In practice, it will take some experimentation (and careful measurement) to calculate your optimal acquisition cost.
The starting point for this calculation is the determination of the lifetime value of a client. (Your optimal client acquisition cost will be a percentage of this figure.)
It is difficult to overemphasise the importance of performing this calculation. Without an understanding of the dollar value of a client, it is simply impossible to effectively manage your sales process.
In our experience, because most organisations have no way to value a client relationship, most grossly underestimate the amount that they are prepared to invest in client acquisition.
This under-investment in client acquisition seriously retards the growth of many organisations.
The publishing industry is one industry that does understand the concept of lifetime value. Typically publishers of magazines and other periodicals are prepared to invest at least 100% of the first year’s subscription revenue in order to acquire a new subscriber!
Valuing a client relationship
In financial terms, a client relationship is simply an annuity income stream.
It follows that you can value a client relationship, just as you can value any other kind of annuity (income-producing investment).
You value an annuity using a net present value calculation. (Net present value is the sum of a series of future payments, discounted for the cost of capital.)
To calculate the lifetime value of a client, determine the gross profit you earn in an average year from an average client, then multiply this by the figure in the annuity table below that corresponds to the number of years you retain this average client.
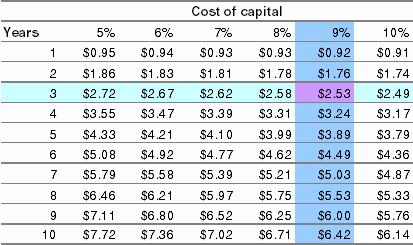
This table shows how much a series of $1 payments, to be paid at the end of each year for a specified number of years into the future, is currently worth, with interest at different rates, compounded annually. In other words, the table shows what you should be willing to pay, today, in order to receive a certain series of future payments of $1 each.
As you already know, Correlex sells a consulting service for $450 a month.
To calculate the lifetime value of an average client, it must multiply the gross profit in a transaction by the number of times Correlex transacts with an average client over the lifetime of the client relationship.
On average, Correlex retains a client for three years. Its gross profit is 70% (or $315).
It chooses to account for cost of capital at its overdraft rate, 9%.
Correlex calculates the net present value of a client relationship by first calculating its annual gross profit, and then multiplying this figure by the appropriate multiplier from the table above:
Average annual gross profit: $450 x 12 x 70% = $3,780
Net present value: $3,780 x $2.53 = $9,563
The CEO of Correlex is surprised to see just how valuable a client relationship is.
Prior to performing this calculation, he was considering reducing his promotional expenditure ($400 per client seemed like a lot — especially for an engineering firm).
Now, however, he suspects that he has been underspending on client acquisition!
Accordingly, he decides to set his optimal client acquisition cost at a (conservative) $900. He also resolves to watch his KPIs carefully and review this figure in six months’ time.
As explained, your optimal client acquisition cost will be a percentage of the lifetime value of a client. The actual percentage will depend on the fixed costs associated with your sales process (and your sales volume). It will almost certainly be more than 10%. It may even be as high as 50%.
(While the idea of investing 50% of the lifetime value of a client in client acquisition may seem ludicrous, it’s important to remember that, once an organisation has passed its break-even point, it’s effectively enjoying a 100% return on this promotional expenditure. Try earning that in the bank!)
Before he can finalise his global performance indicators, the CEO of Correlex must determine his optimal client acquisition rate. A quick call to his operations manager confirms that Correlex is capable handling four new clients a month.
These indicators provide Correlex’s CEO with an overview of the relationship between his sales process’s inputs and outputs.
His suspicion that he is underspending on promotion is supported by the fact that Correlex is growing at 50% of its optimal rate.
Because your global KPIs are longer-term indicators, they do not enable you to manage your sales process on a day-to-day basis.
To do this, we need to divide your sales process into its key components, and then devise a set of performance indicators for each.
You’ll remember that a sales process consists of three components:
- Relationship acquisition
- Relationship management
- Opportunity management
Let’s start with the final component of the sales process and work backwards.
Opportunity management
The objective of your opportunity management process is to convert sales opportunities into sales (remember, we’re assuming that a sale is a new client). This process will generally involve salespeople, operating either in the field, or from a call centre (or both).
A sales opportunity is typically an expression of interest in a specific product or service, generated as a result of your opportunity management process. (Sales opportunities are often called leads.)
As with your sales process as a whole, we are primarily interested in the throughput and the productivity of your opportunity management process.
Accordingly, we will begin by measuring:
- Client acquisition rate (clients per month)
- Opportunity conversion rate (sales/opportunities x 100)
Of course, the throughput of the opportunity management process (client acquisition rate) will be identical to the throughput of your sales process as a whole.
Your conversion rate is the percentage of sales opportunities that convert into sales.
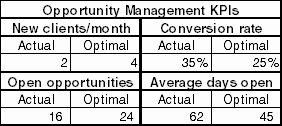
The CEO of Correlex already knows his client acquisition rate.
What he doesn’t know, is how many sales opportunities his consultants require in order to make each sale.
A survey of his consultants’ sales figures indicates that, on average, his consultants convert one in every 2.9 sales opportunities into sales. (Accordingly, his conversion rate is 35%.)
But these sales figures also reveal an interesting phenomenon. Correlex’s CEO observes that conversion rates vary considerably from consultant to consultant. He also notices that there seems to be an inverse relationship between acquisition rate and conversion rate for individual consultants.
In other words, the consultants who acquire the most new clients tend not to have the highest conversion rates, and visa versa.
He wonders why …
Optimising conversion rates
Contrary to popular belief, the primary influencer of conversion rate is not the skill of salespeople.
Rather, it is the design of the opportunity management process.
In our experience, opportunity management processes are best designed with a view to minimising the time between the emergence of a sales opportunity and closure of that opportunity (a sales opportunity is closed when it is won, lost or abandoned).
Increasing the throughput of a sales process may result in lower conversion rates, but this is not necessarily a bad thing!
Sales managers typically manage their salespeople as if a conversion rate of 100% is achievable.
In reality, 100% is rarely an optimal conversion rate. The reason is that, as conversion rates go up, throughput goes down.
Ask yourself, which would you prefer: a salesperson who conducts 5 appointments a day, with a 40% conversion rate; or a salesperson who conducts 3 (highly qualified) appointments a week, with a 95% conversion rate? (Hint: salesperson A generates 10 sales a week, where salesperson B generates less than 3.)
You can take the following steps to increase the throughput of your sales process:
- Break the opportunity management process into a number of logical steps.
- Ensure all sales opportunities follow the same process.
- At each step in the opportunity management process, be sure to up-sell to the next step.
- Actively manage open opportunities.
You can manage individual (open) opportunities with a simple tabular report, like the one below. Normally, a sales team will work through this report in its weekly sales meeting. The key indicators to watch are the number of open opportunities and average days open. (If you sell a number of products with different price points, you may prefer to monitor the dollar value of opportunities).
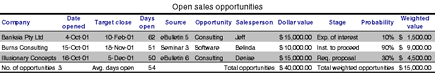
Most CRM systems produce such a report; alternatively, you can create your own in Excel.
You can also use the weighted value and target close data from this report to produce sales forecasts.
Correlex’s CEO reviews his consultants’ differing opportunity management processes. He identifies the consultant with the most efficient process and resolves to benchmark this process and make it the organisational standard.
This new benchmark calls for a conversion rate of 25% and an average days open of 45 days.
From these figures, he calculates that, at any one point in time, his organisation should have one and a half months’ worth of open opportunities:
Optimal monthly sales: 4
Opportunities required to make 10 sales: 4 / 25% = 16
Average days open: 45 (5 months)
Optimal open opportunities: 16 x 5 = 24
Relationship management
The objective of your relationship management process is to generate a steady stream of sales opportunities from your relationships under management.
We do this by creating an automated communication program. This is a sequence of ongoing communications, where each communication is designed to add value to these relationships.
A typical communication program will consist of a monthly e-mail newsletter and bimonthly seminars or workshops.
We tend to take an indirect (longer-term) approach to the generation of sales opportunities. Our experience is that, if you can design the relationship management process to position your organisation as the leader in its particular field, sales opportunities will be forthcoming.
Events and other activities can be used to stimulate the flow of activities, but on many occasions, these activities will simply time-shift the emergence of opportunities — rather than creating opportunities you wouldn’t otherwise have received.
You need to balance your need for sales opportunities against the requirement to add value to the relationships under your custodianship. There is a danger that, if you design your communications specifically to maximise the flow of sales opportunities, you may compromise the integrity of these relationships.
As with our other processes, we are primarily interested in monitoring throughput and productivity. Accordingly, our KPIs are as follows:
- Opportunities per month.
- Opportunity realisation rate (monthly opportunities/relationships).
Opportunity realisation rate advises you of the correlation between the number of relationships you have under management (the size of your database) and the number of sales opportunities these relationships produce each month.
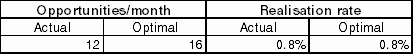
Correlex has 1,500 contacts on its database. Because all of these contacts are recipients of Correlex’s monthly e-mail newsletter, it referrs to them as subscribers.
On average, Correlex receives 12 sales opportunities a month from its subscriber database.
These 12 opportunities represent an opportunity realisation rate of 0.8%:
12 / 1,500 x 100 = 0.8%
In order to increase the flow of sales opportunities to the 16 per month required, Correlex’s CEO realises he must acquire an additional 500 subscribers:
16 / 0.8% = 2,000
Relationship acquisition
The objective of your relationship acquisition process is to acquire a steady stream of relationships with potential clients and centres of influence.
The input into this process is the investment in your relationship-acquisition campaigns (remember, we’re only tracking variable costs). The output is obviously the relationships (or subscribers) you add to your database.
The precise management of this process is critical for two reasons:
- The flow of inbound opportunities is the key determinate of the throughput of the process as a whole.
- In the absence of an objective performance measure, there is a high probability that you will either under- or over-spend on promotion.
Our performance indicators for this process are:
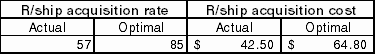
- Relationship acquisition rate (relationships per month).
- Relationship acquisition cost (cost per relationship).
Relationship acquisition cost is calculated by dividing the variable cost of promotional campaigns by the number of new relationships acquired by those campaigns.
As with our global KPIs, these indicators don’t mean much until we can compare actual and optimal figures.
Optimising your relationship acquisition process
The calculation of your optimal relationship acquisition rate is easy. This figure is determined by:
- Your target database size.
- Your availability of promotional funds.
- The capacity of your relationship acquisition process.
The calculation of your optimal relationship acquisition cost requires a little more thought.
The amount that you are prepared to spend in order to acquire a new relationship must obviously relate to the value of such a relationship.
But how can you value one more name on your database?
The solution is to value relationships using exactly the same methodology we used to value clients.
Your database of subscribers provides you with a flow of sales opportunities.
You can value a sales opportunity by discounting your optimal client acquisition cost for your conversion rate. (In other words, if your conversion rate is 10%, a sales opportunity is worth 10% of your optimal client acquisition cost.)
Accordingly, to value one new subscriber, all you have to do is calculate the odds of that subscriber becoming a client over the life of their relationship with you.
While you can easily calculate the life of a client relationship, it’s a little harder to calculate the life of a subscriber. In our experience, it’s rare for subscribers to unsubscribe from our automated communications program.
For this reason, we arbitrarily choose to value subscribers over the same lifespan as clients. Accordingly, if the life of an average client is three years, we value subscribers over this same period.
The CEO of Correlex is prepared to invest $900 to acquire a new client.
Because his optimal conversion rate is 25%, a sales opportunity is worth $225.
$900 x 25% = $225
He knows that his automated communication program provides him with an opportunity realisation rate of 0.8% per month. Or, to put it another way, for each subscriber on his database, he will receive 0.8% of a new sales opportunity each month.
Because he arbitrarily decides to value subscribers over a three-year period (36 months), Correlex’s CEO can calculate that there is a 28.8% likelihood of a new subscriber turning into a client over this period.
0.8% x 36 = 28.8%
If 28.8% of subscribers become clients, it follows that a new subscriber is worth $64.80:
$225 x 28.8% = $64.80
Therefore, this $64.80 is Correlex’s optimal relationship acquisition cost.
Correlex’s CEO decides to set his optimal relationships acquisition rate at 85 per month. This will allow him to easily hit his target of 2,000 subscribers within 12 months. (Even accounting for a particularly conservative unsubscribe rate of 42 a month.)